Case Studies
A collection of data analytics projects by Ibinabo Adiela, focused on solving real-world business and healthcare problems. Each case study highlights the analytical approach, tools used, and key insights, with detailed documentation and code repositories included where applicable.
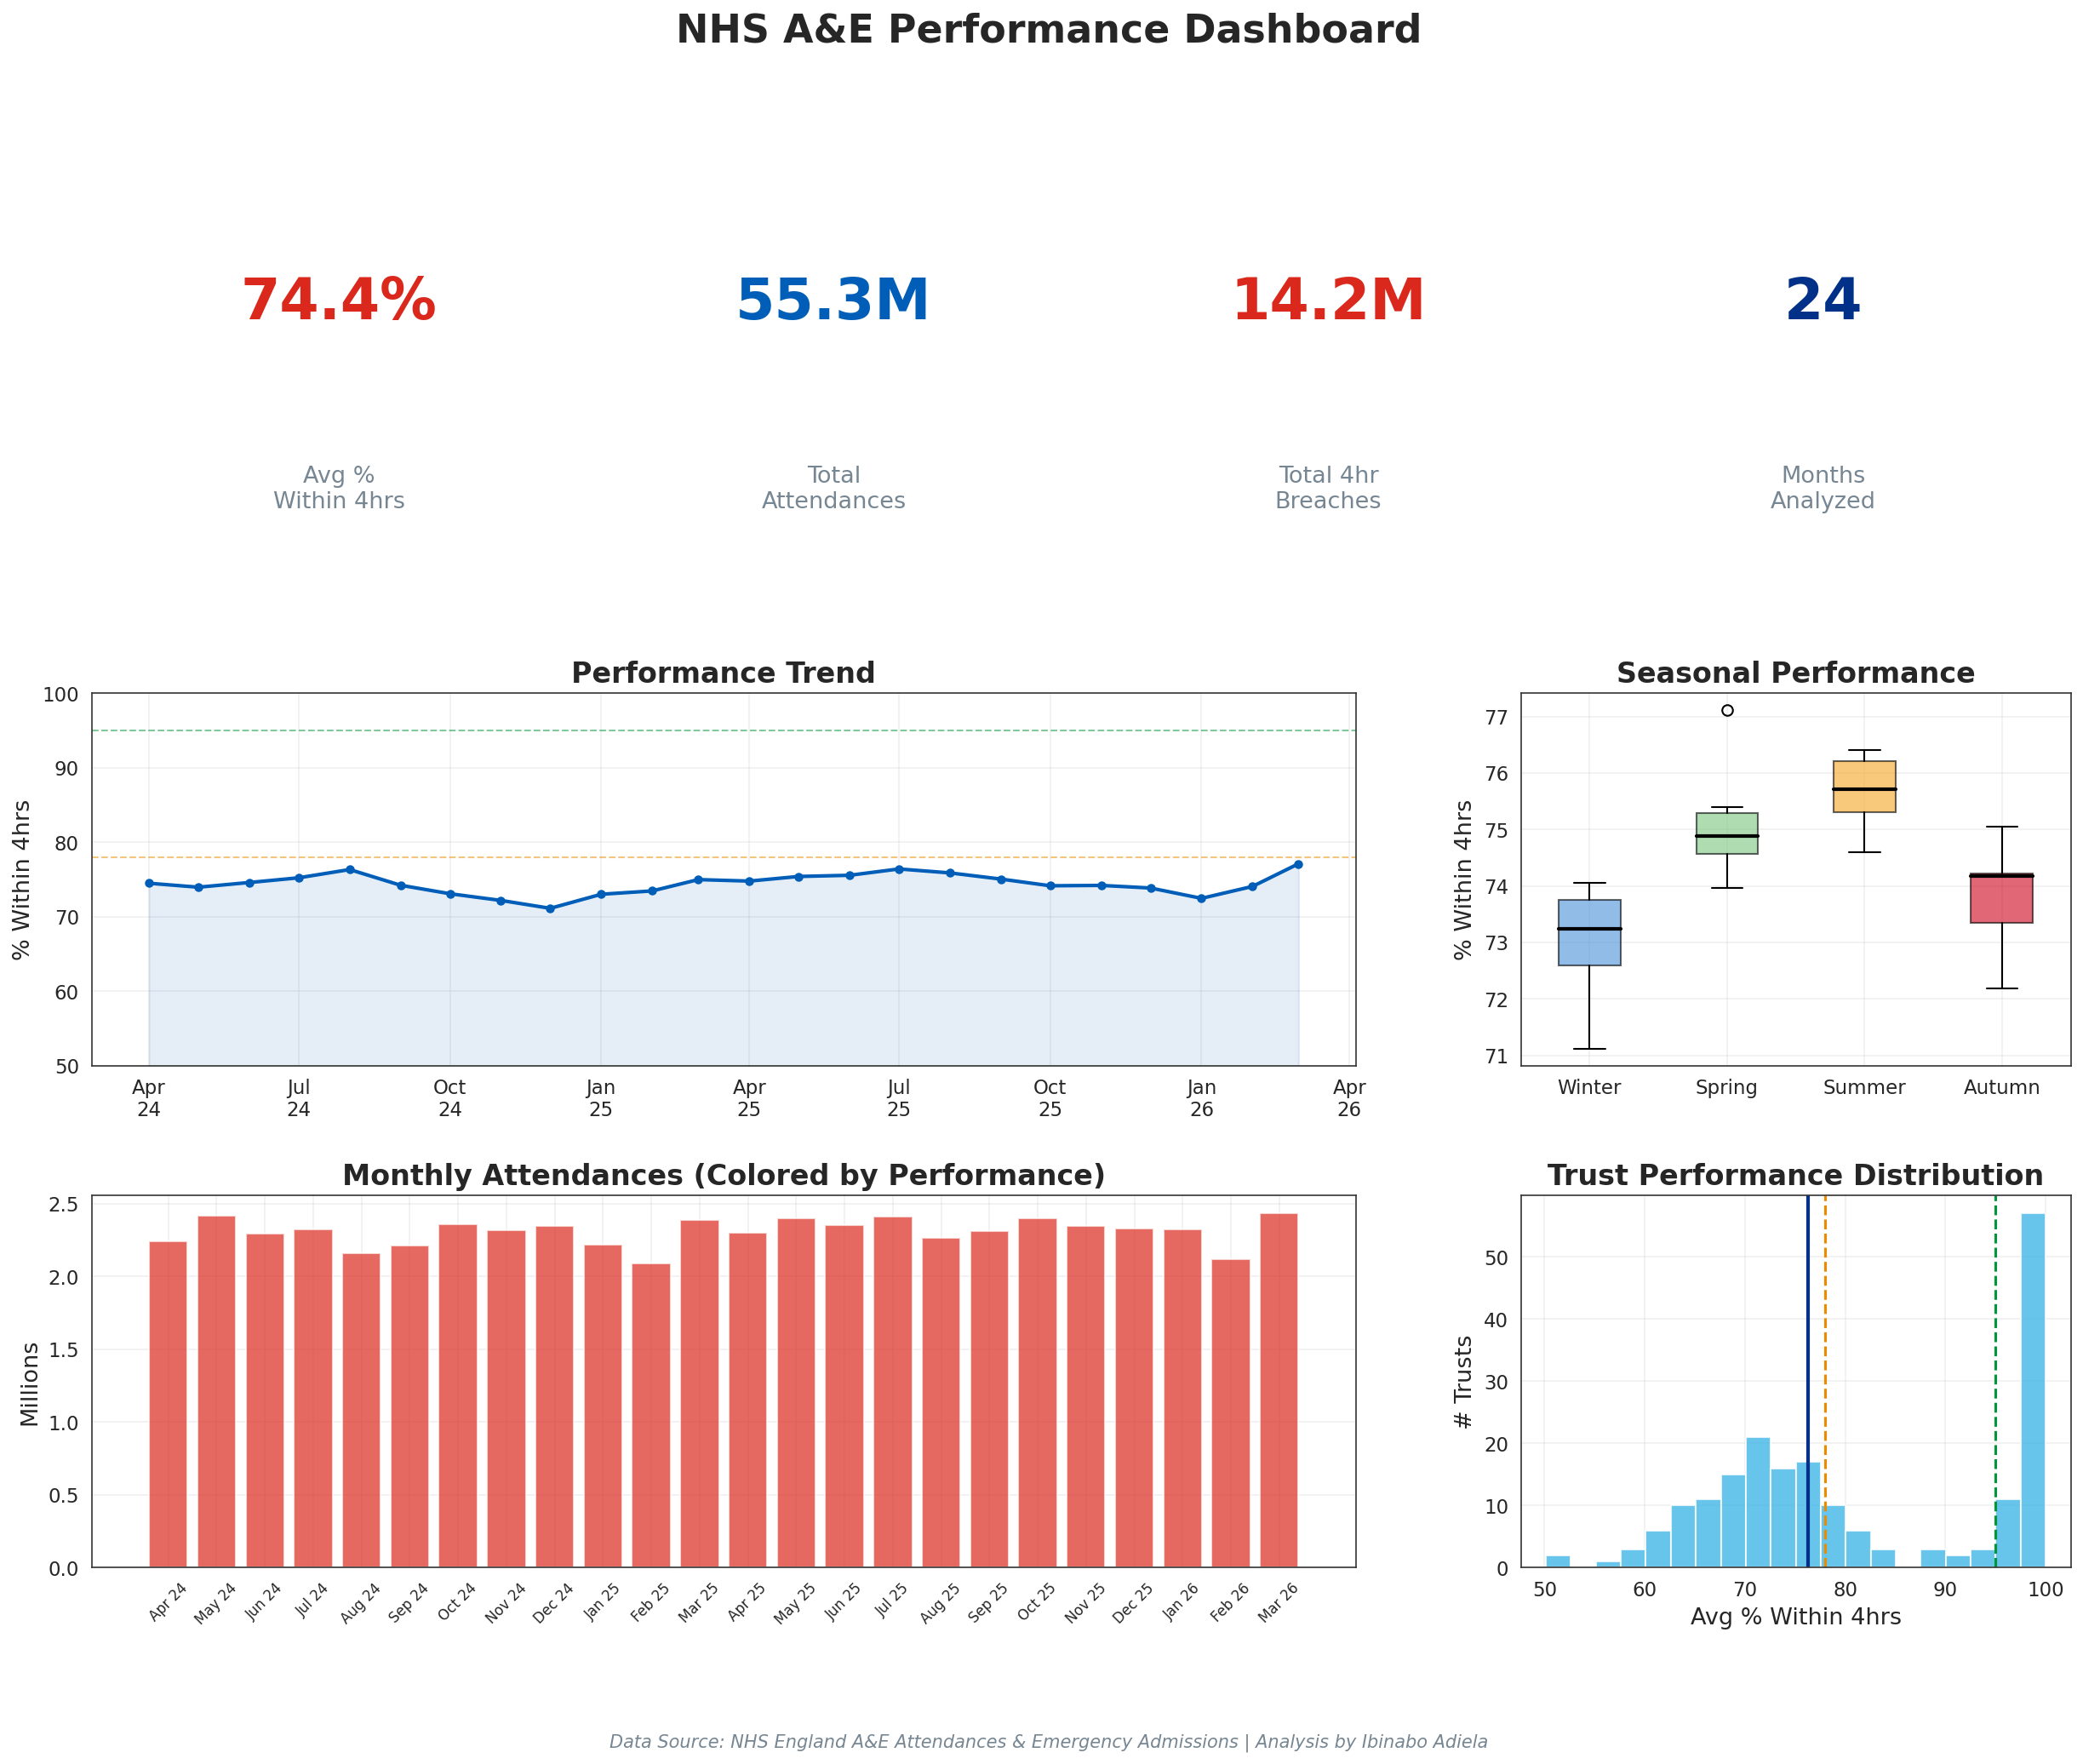
NHS A&E Performance & Pt Wait Time Analysis
An end-to-end healthcare analytics project using Python and Tableau to uncover patterns behind NHS A&E performance.
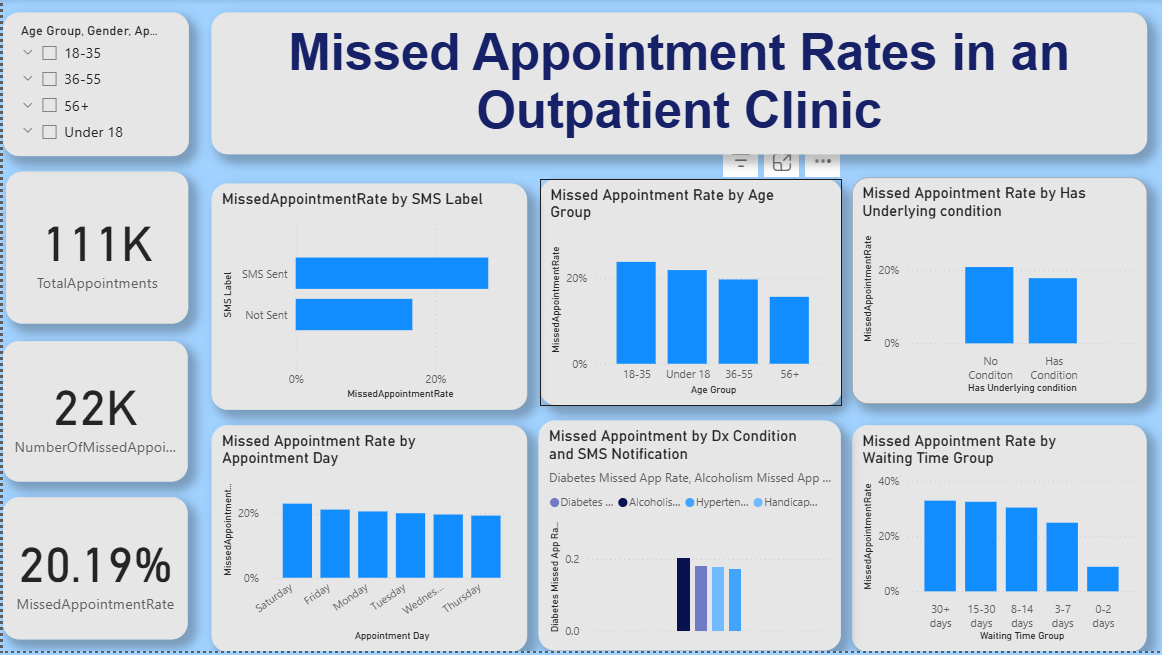
Reducing Missed Appointments in an Outpatient Clinic
An end-to-end healthcare analytics project using Excel and Power BI to uncover patterns behind outpatient no-shows.
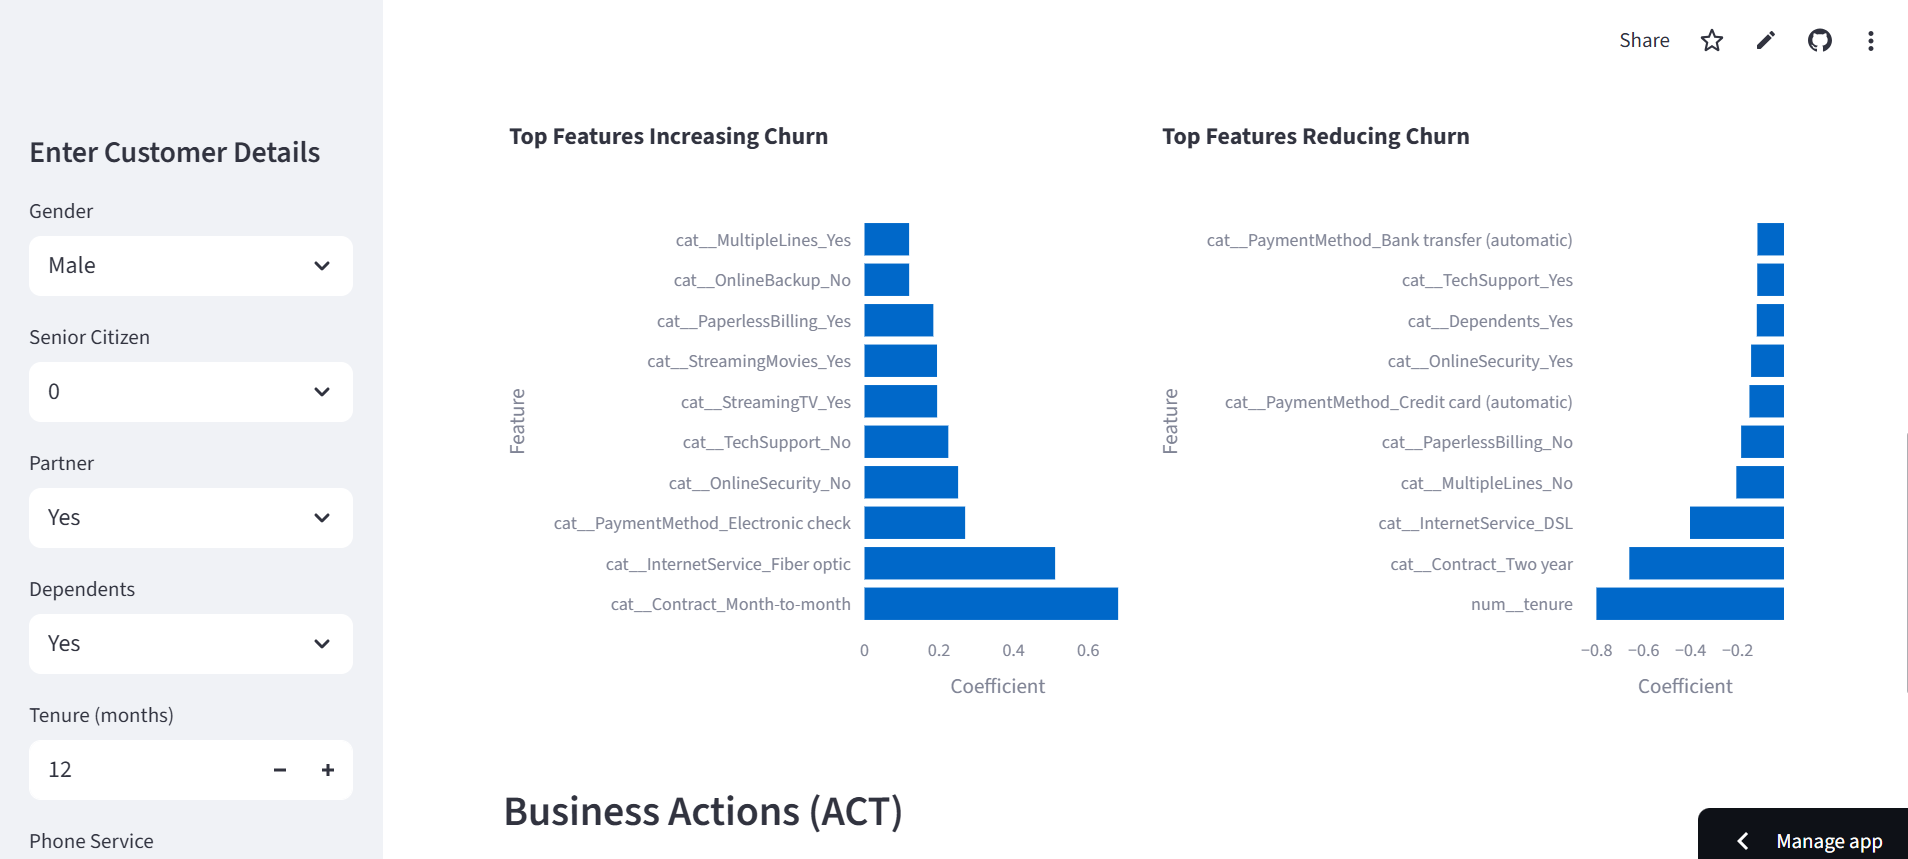
Predicting Customer Churn Risk
Churn prediction system built to help retention teams identify which customers are most at risk and why.
Ethereum Whale Tracking Dashboard
A lightweight on-chain analytics tool for tracking and analyzing large Ethereum transfers and capital movement.
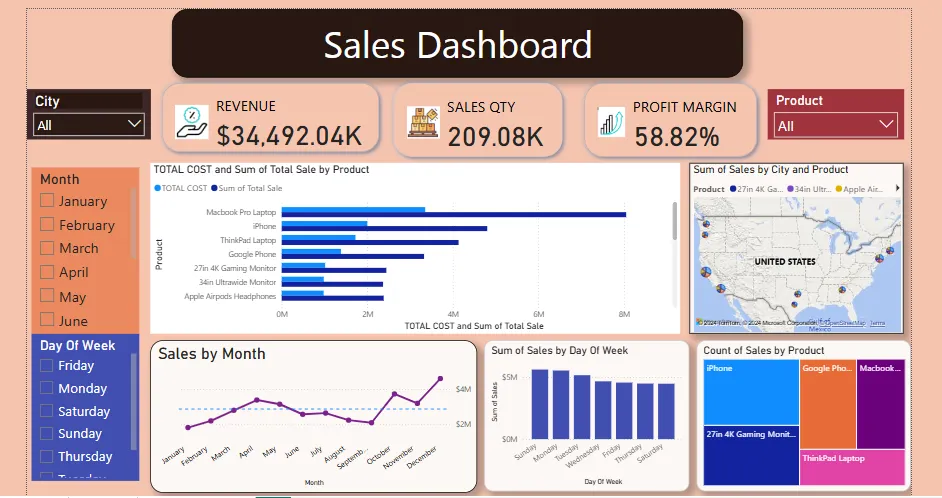
Sales Dashboard with Power Bi
Analyzed sales dataset with 185,000+ rows, identified trends, and created visualizations using Power BI, revealing insights on top-selling products, weekend sales spikes, and opportunities for growth and optimization.
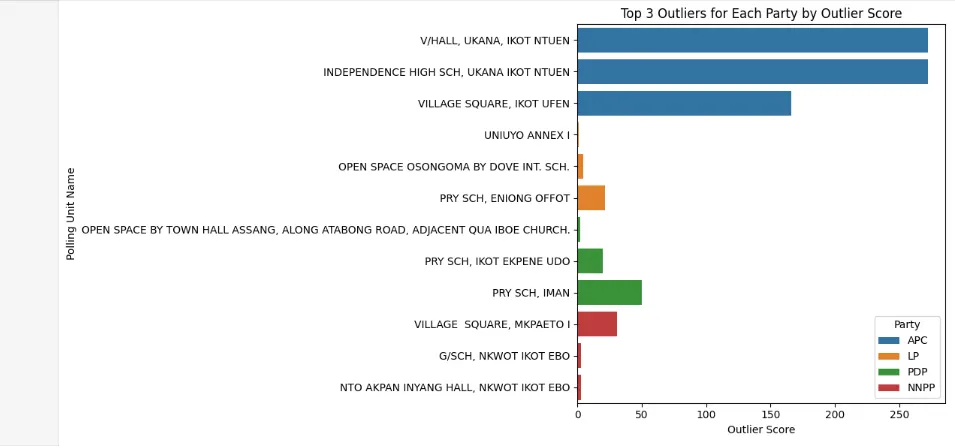
Geospatial Analysis and Outlier Detection of Election Data of Akwa Ibom State
This project examined the 2023 Nigerian election in Akwa Ibom State by calculating outlier scores and identifying significant anomalies.
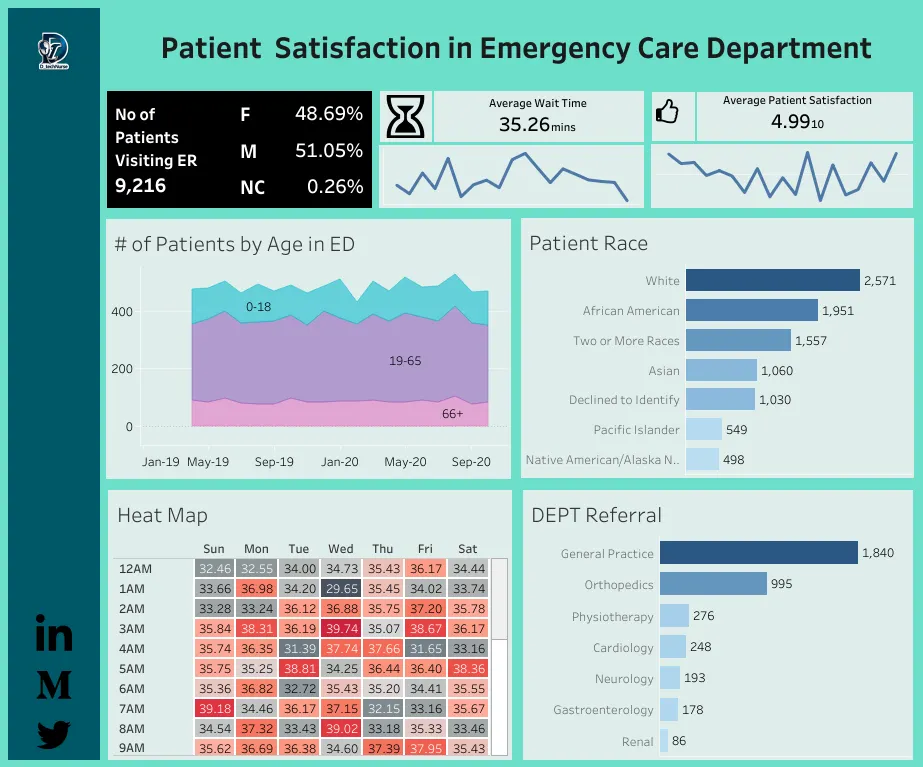
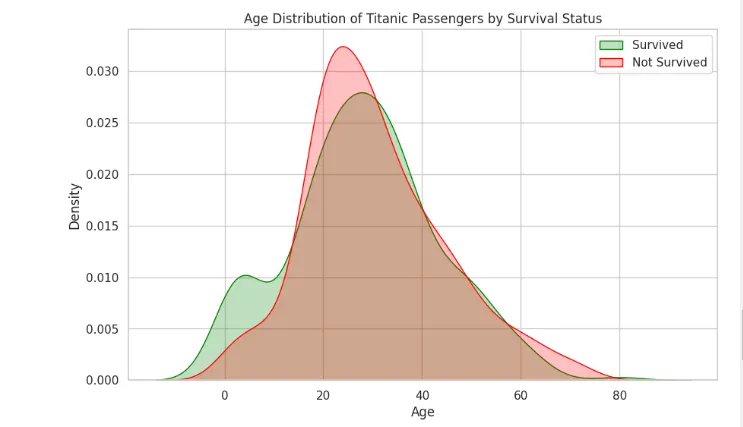
Patient Satisfaction in The Emergency Department
Investigated the factors influencing patient satisfaction in hospital Emergency Departments (EDs) using data visualization techniques in Tableau.
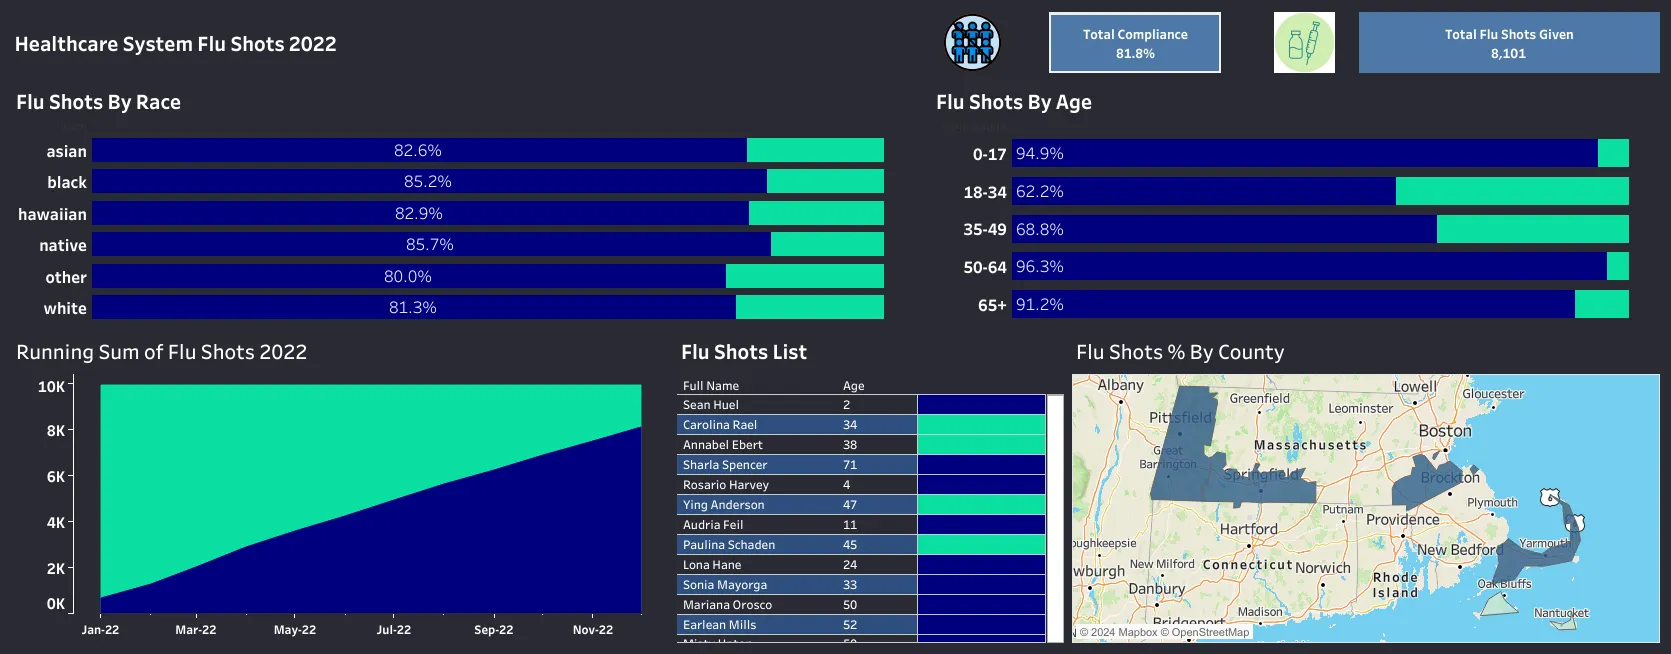
Immunization Analysis using PostgreSQL and Tableau
Analyzed flu shot compliance using PostgreSQL and Tableau, uncovering key insights on vaccination trends across demographics. Developed visualizations to guide targeted healthcare interventions based on age, race, and geographic location

Psychometric AI Model
Using Python programming language and machine learning techniques this project seeks to provide personalized career guidance and recommendations to individuals, empowering them to make informed decisions about their professional trajectories.